


Background
About Eika
Eika is an alliance of independent local banks across Norway. Eika provides economies of scale, services and products to the banks and their customers.
Eika
A concept for mobile and online banking


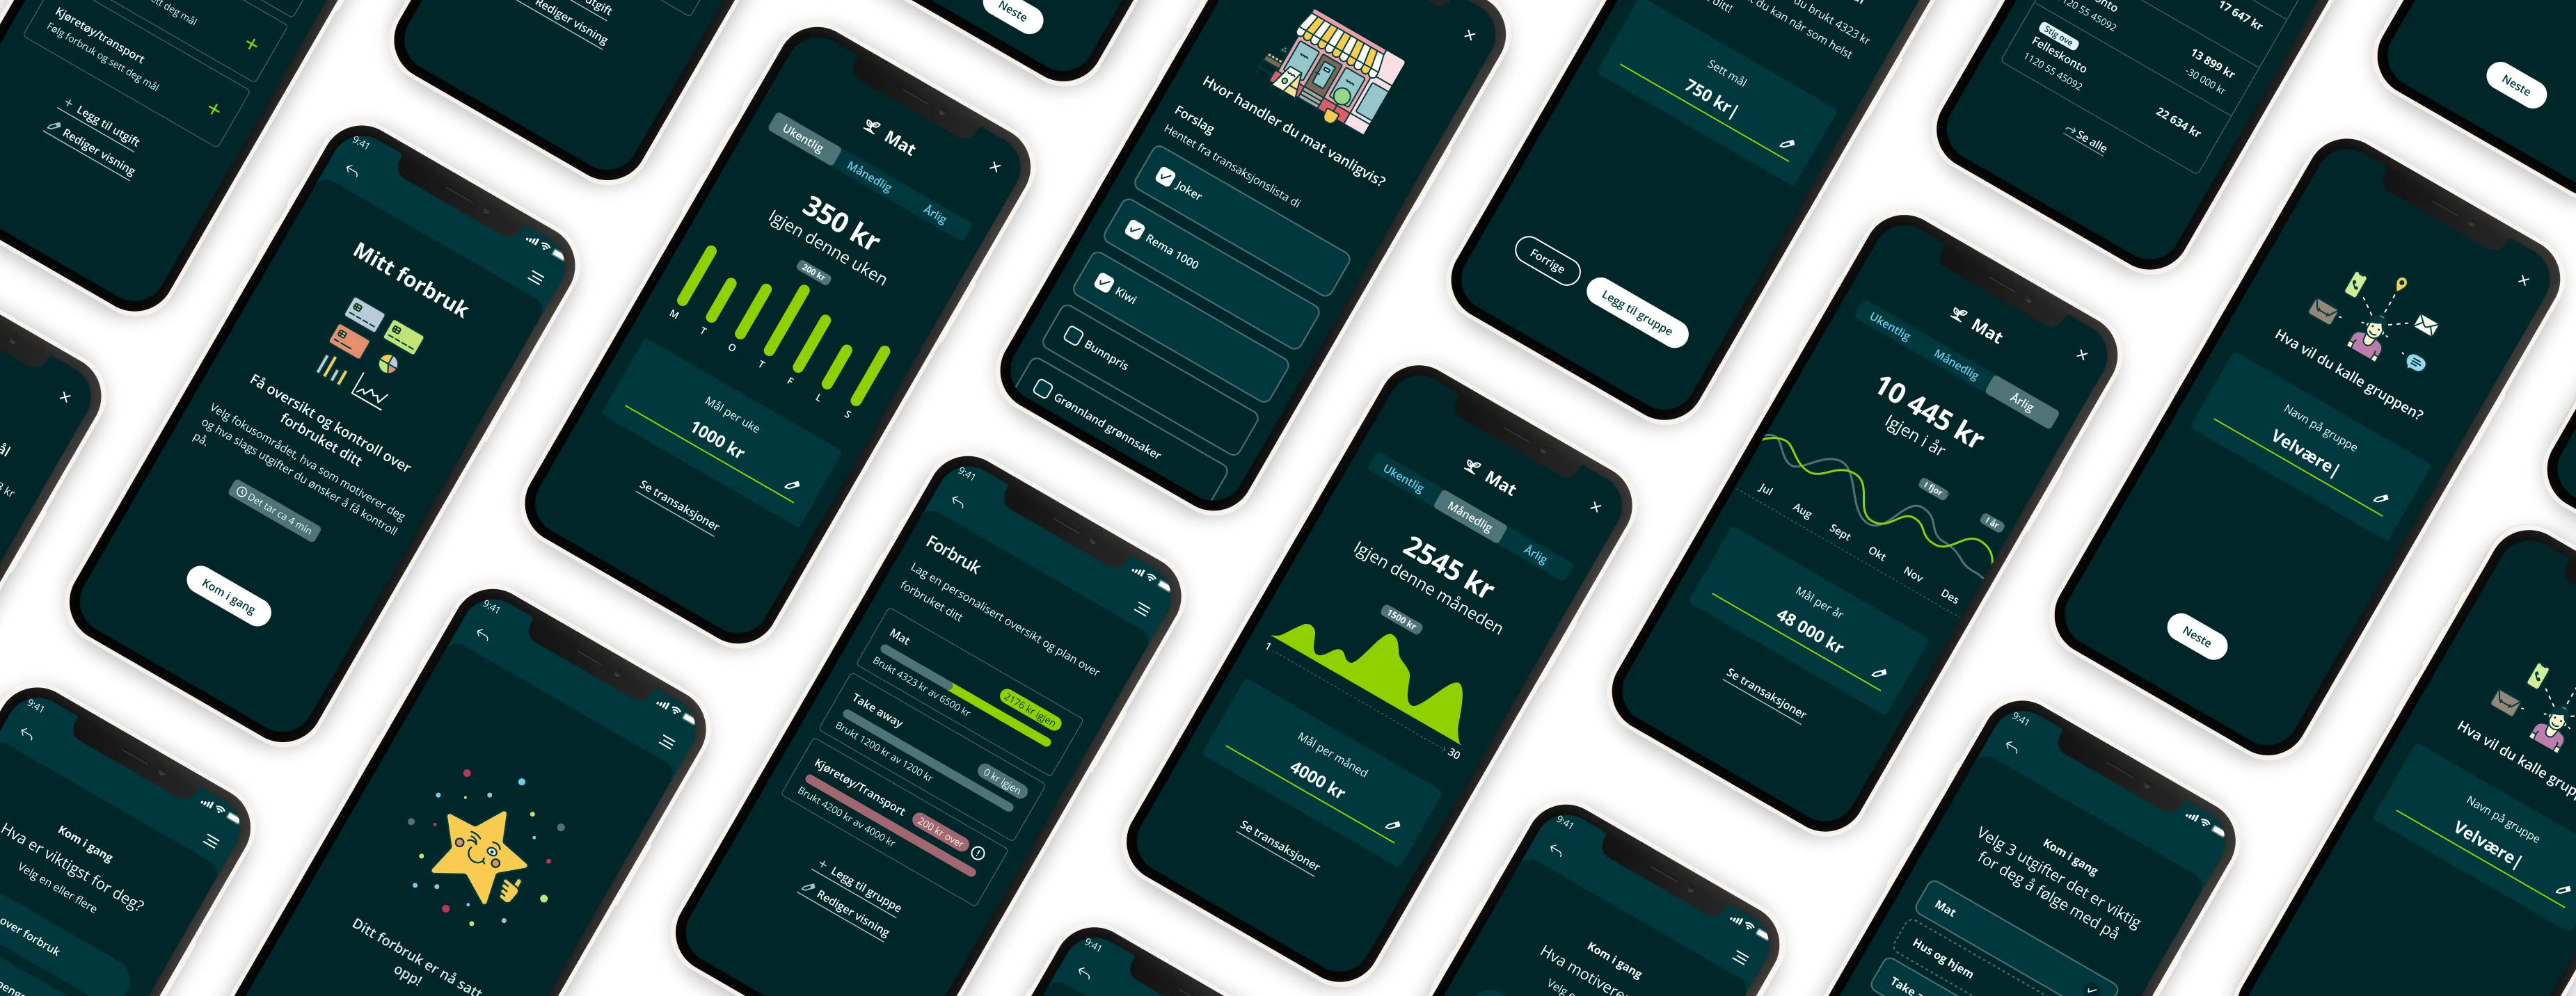
Mitt forbruk (My spending) was a concept for Eika’s mobile and online bank, where we explored how bank data could help customers get a better overview of their own finances. Many wanted more control over their spending, but the research also showed that money can be a sensitive topic. The goal was therefore to find a way of giving insight that felt useful and motivating rather than judgemental.
The result was Mitt forbruk, where users choose which expenses they want to follow and set their own goals for them. Transactions help categorise the spending, while the solution shows how it develops over the week, month and year. A short onboarding lets users choose what they want to focus on and makes it easier to get started.
We started with interviews to understand how people relate to their own finances and what they wanted help with. We then interviewed six people recruited through Norstat and used the insight to define needs and develop different concepts. The concepts explored spending, goals and different ways of visualising finances, among other things, and were tested and adjusted along the way.
An important finding was that many of those who needed the most help with their finances did not want to be reminded of how much they had spent. They were more motivated by seeing how much they had left to spend. So we shifted the focus from past spending to goals and money left, and toned down visual cues that could feel negative or judgemental.
Background
Eika is an alliance of independent local banks across Norway. Eika provides economies of scale, services and products to the banks and their customers.

Role
In Eika’s mobile and online bank team, I worked on the services people use in their everyday banking, such as payments, transfers and opening accounts. I also worked on more complex tasks, including international payments.
A bigger project was Mitt forbruk (My spending), where we explored how customers understand and use information about their own spending. Below I show how we worked with insight in this project.
Project
Many customers lack insight into their own finances, which makes it hard to make good financial choices. We therefore explored how bank data, such as transaction lists and income and expense overviews, can help our customers gain more control and make better-informed decisions.
Process


Insight
We started by interviewing friends and acquaintances to get a starting point. Many wanted to track their spending, especially in specific areas like cafés, food and eating out, rather than getting a total overview. Several also found comparing themselves with others’ spending motivating and interesting.
We interviewed six people, recruited through Norstat. The participants were cost-conscious but didn’t need to be customers of an Eika bank, and their ages ranged from 27 to 53.
The conversations focused on their relationship with money, how they keep track of their spending, and how they plan their finances month by month.

Archetypes
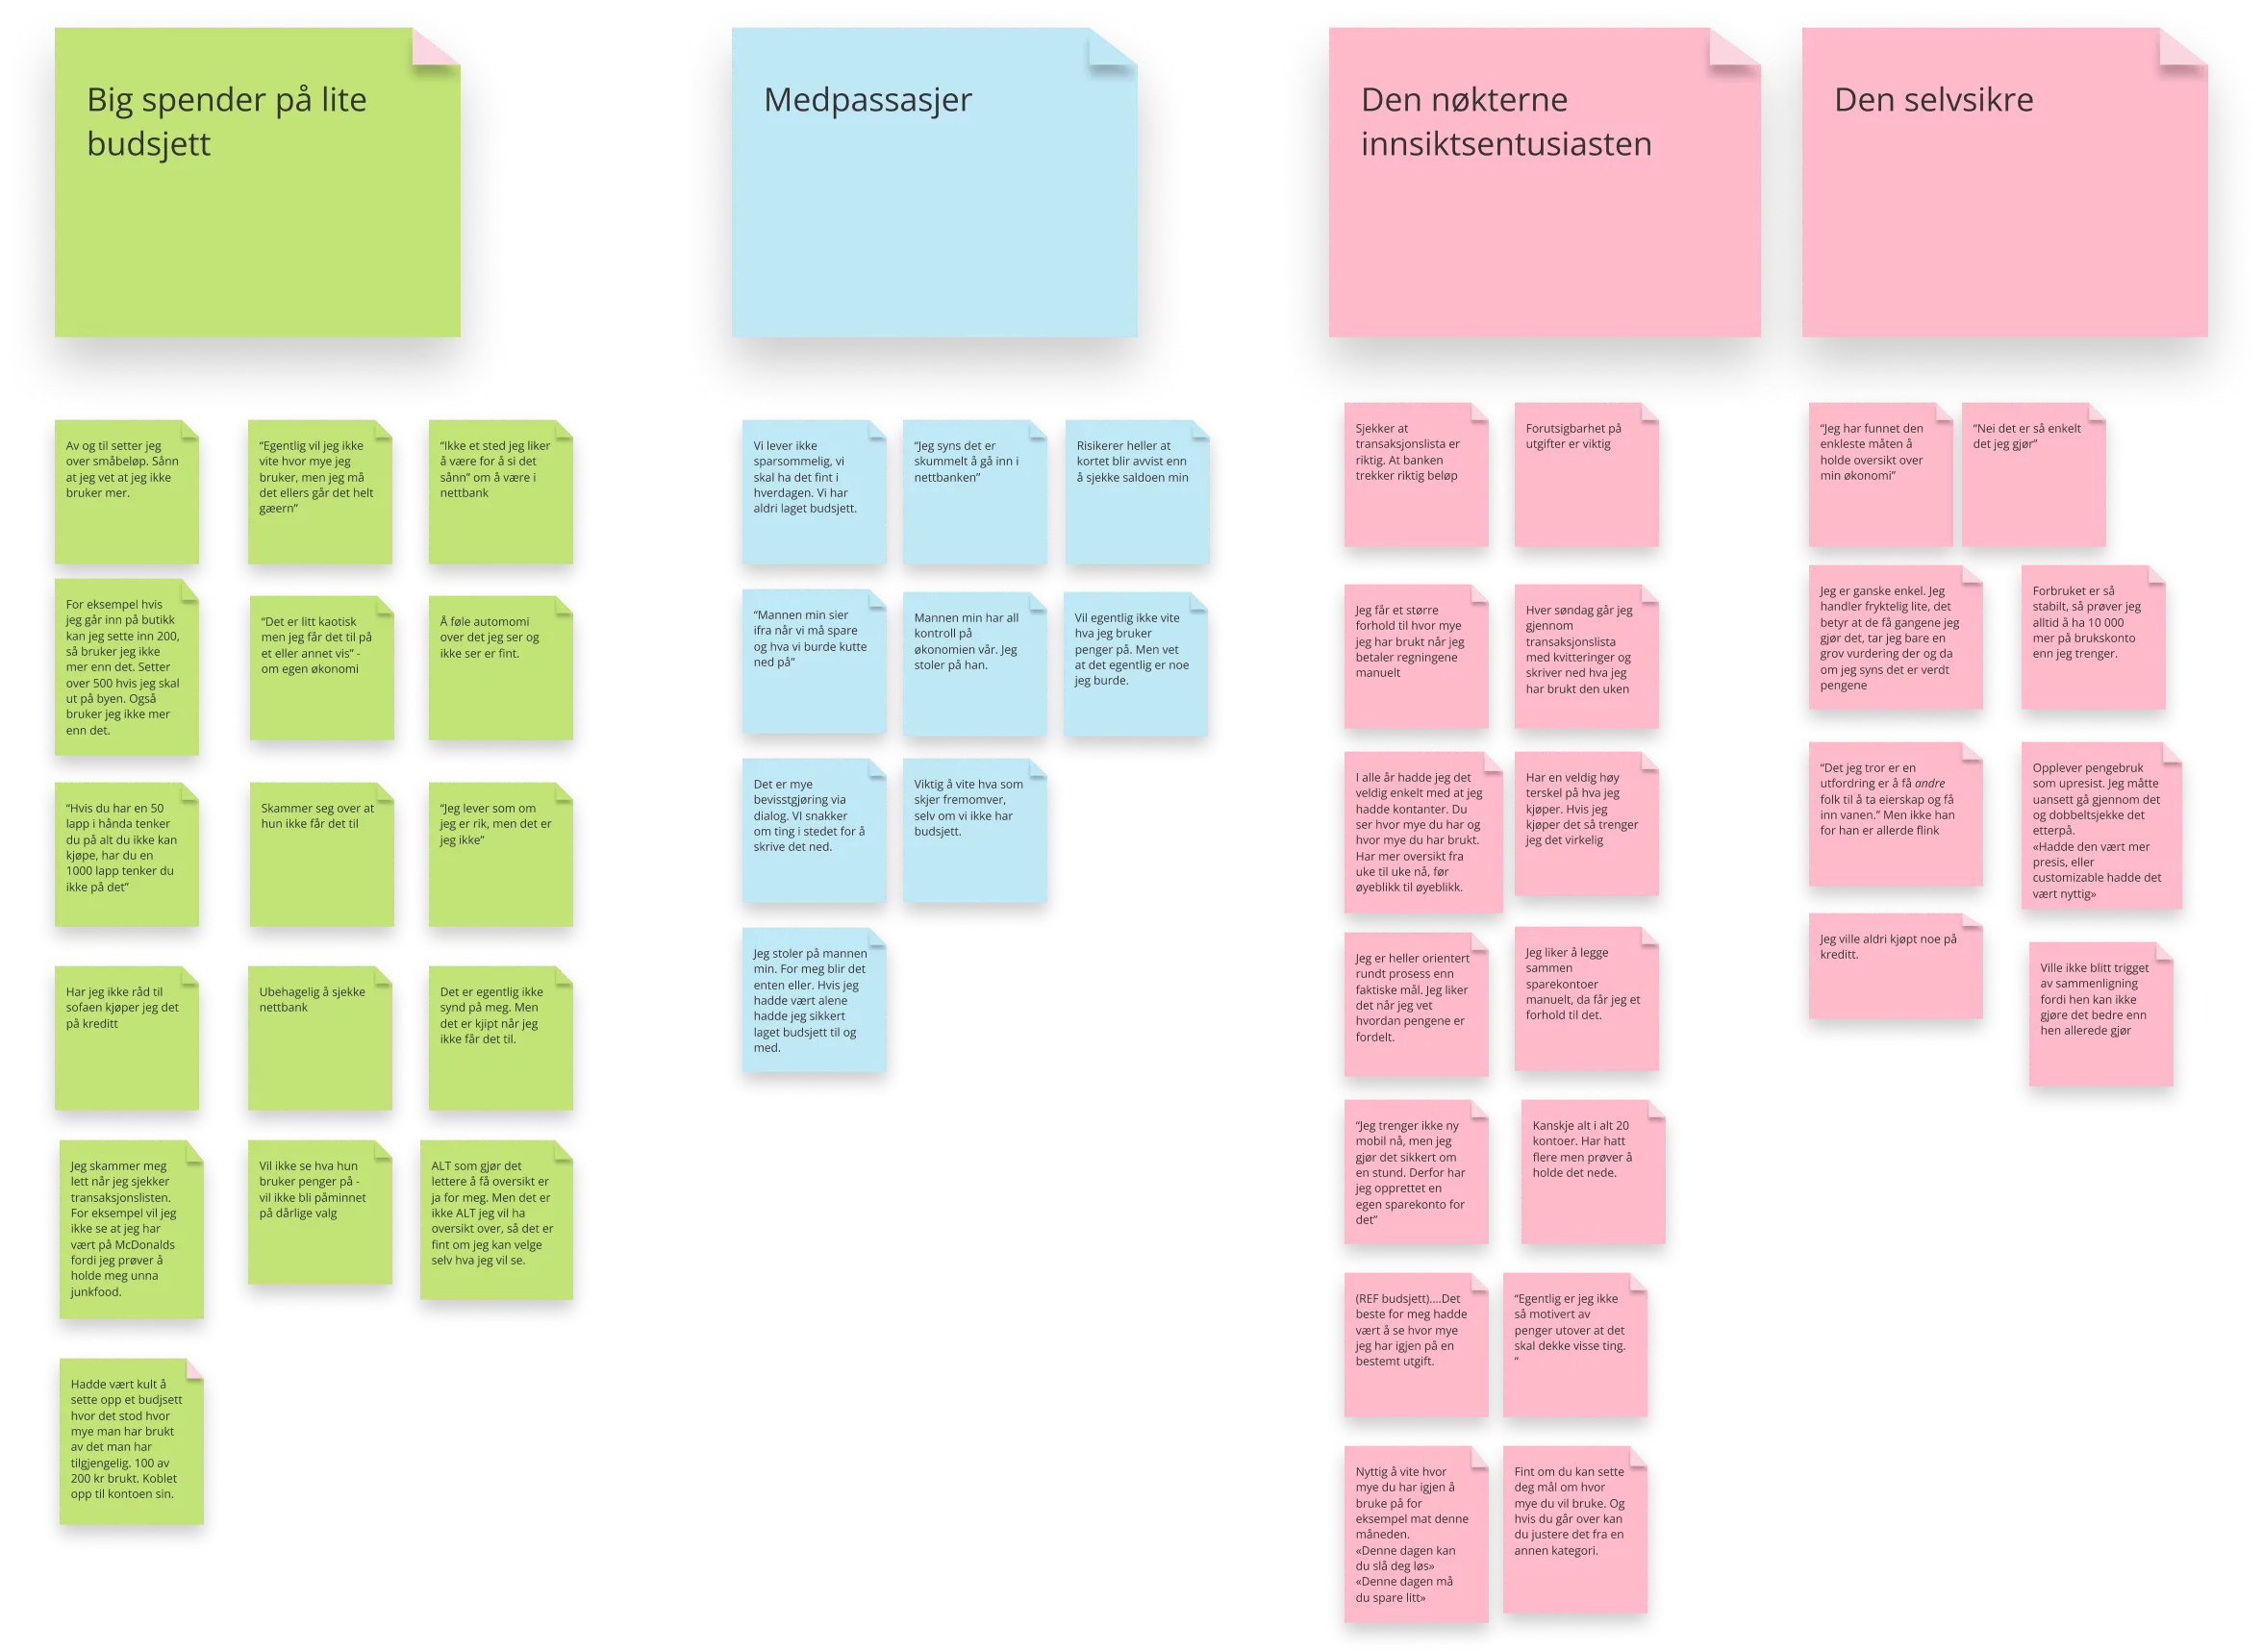
Based on the interviews, we developed four archetypes, shown below with relevant quotes from the participants.



Analysis
Opportunities
Set goals based on previous spending. Focus on spending a little less, getting a little better. Small steps.
Focus on what you have, not what you don’t have.
Give users full autonomy to choose what they want to see – and hide what they don’t.
Let users decide whether to focus on how much money they’ve spent, or how much they have left.
For example, show a plant that grows and blooms if you’re doing well financially, and wilts if you’re spending a lot.
Concepts
After analysing the interviews, we started developing concepts. We explored ways of showing how much has been spent and how much is left, as well as visual ways of presenting spending.
Below are the concepts together with feedback from the user tests.
Concept 1
The first interviews gave us a clear impression that we should focus on expenses and how much you spend over a period.
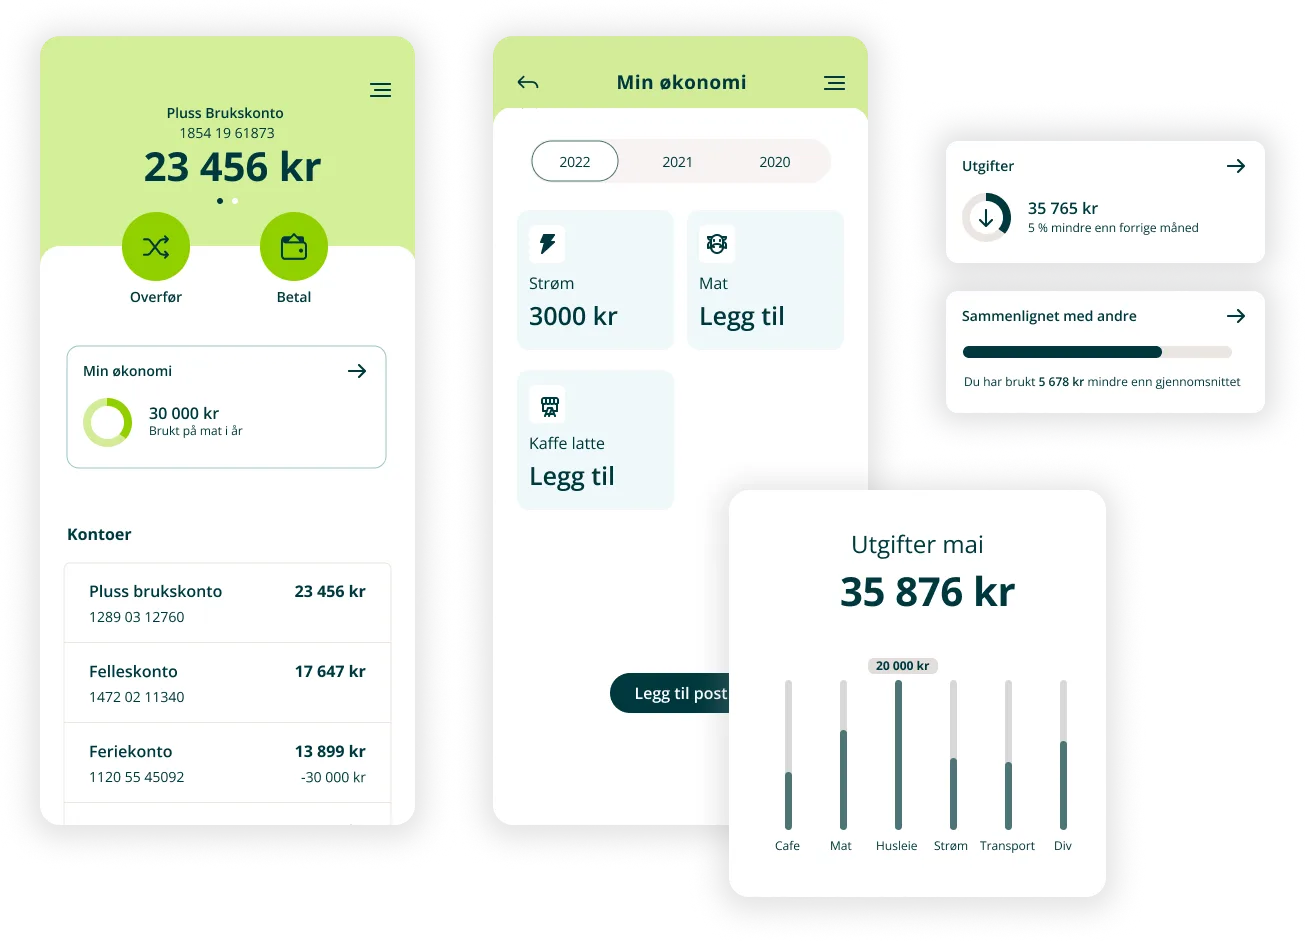
Based on this, we developed a concept where users choose which expenses they want to follow. It lets them get either a total overview or focus on specific expense categories. Using the transaction list, we can automatically identify how much is spent in different areas.
We heard that many don’t want to know how much they spend, and find it more interesting to know how much money they have left.
Many also felt that comparing themselves with others was either terribly uncomfortable or pointless.
Concept 2
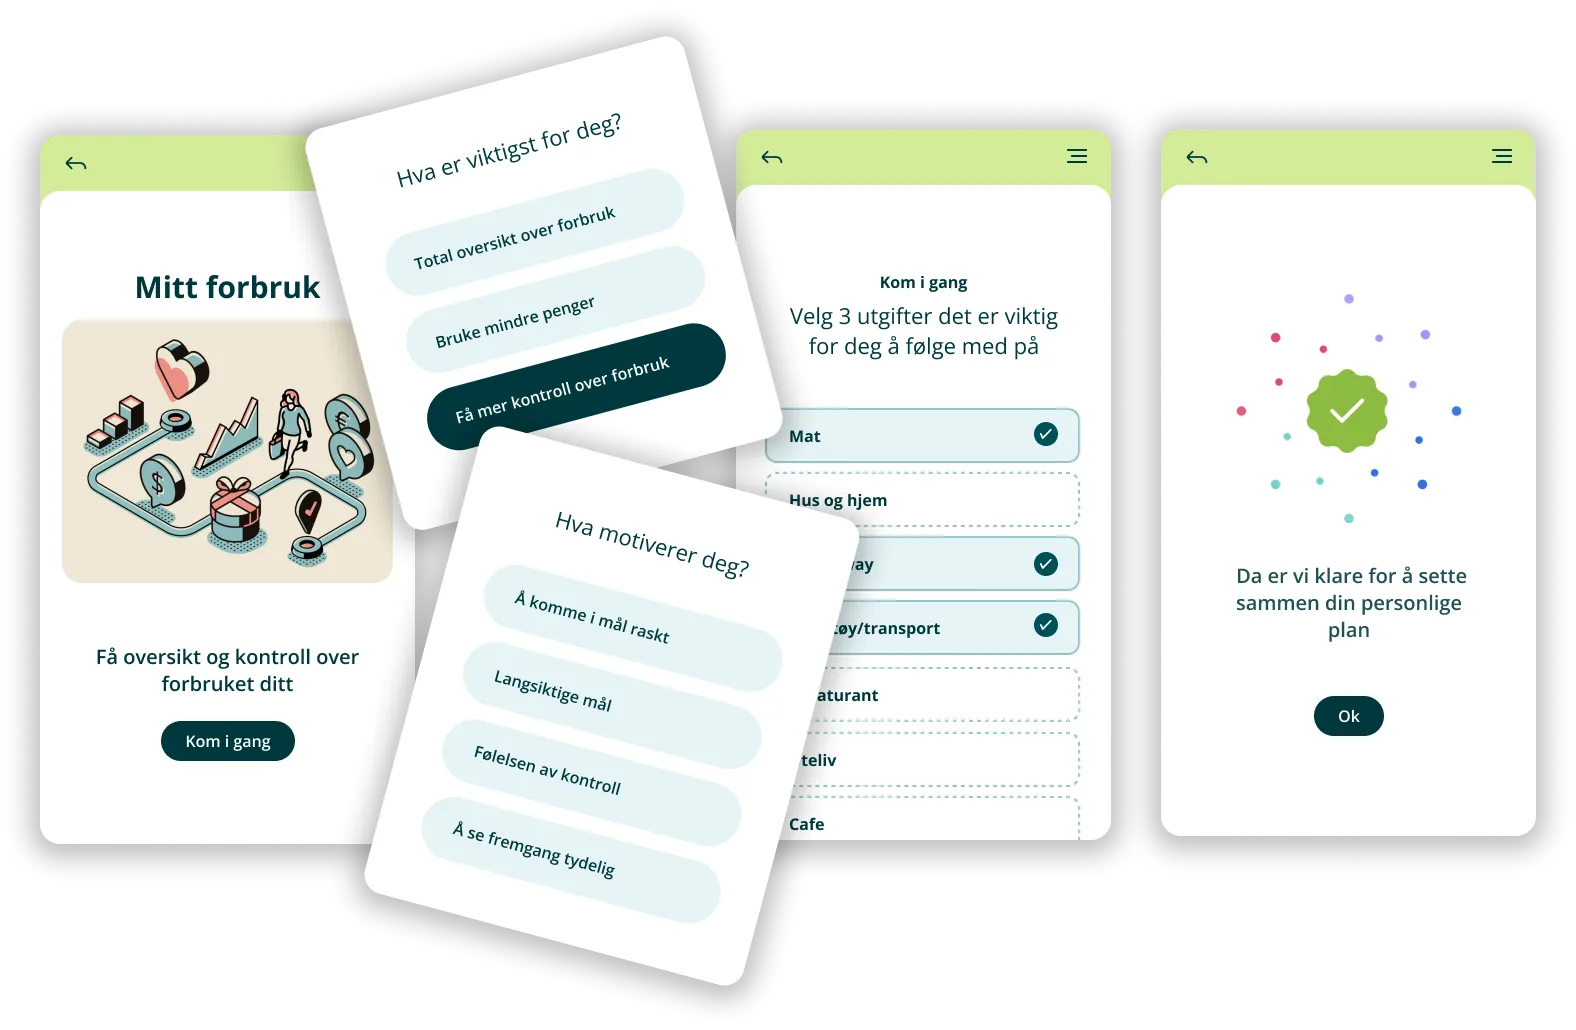
We felt it was important to give users a proper onboarding to Mitt forbruk, so it’s easy to get started. Here users choose their focus areas, what motivates them and which expenses they want to follow.
People liked the illustrations! They also said it would be nice to know how long it takes and what you have to go through on the first screen. They liked being able to choose focus and motivation, but wanted to be able to choose more than one.
For many of the people we talked to, for whom money is a sensitive topic, it was good to have many expenses to choose from – it meant their expenses were real.
Concept 3
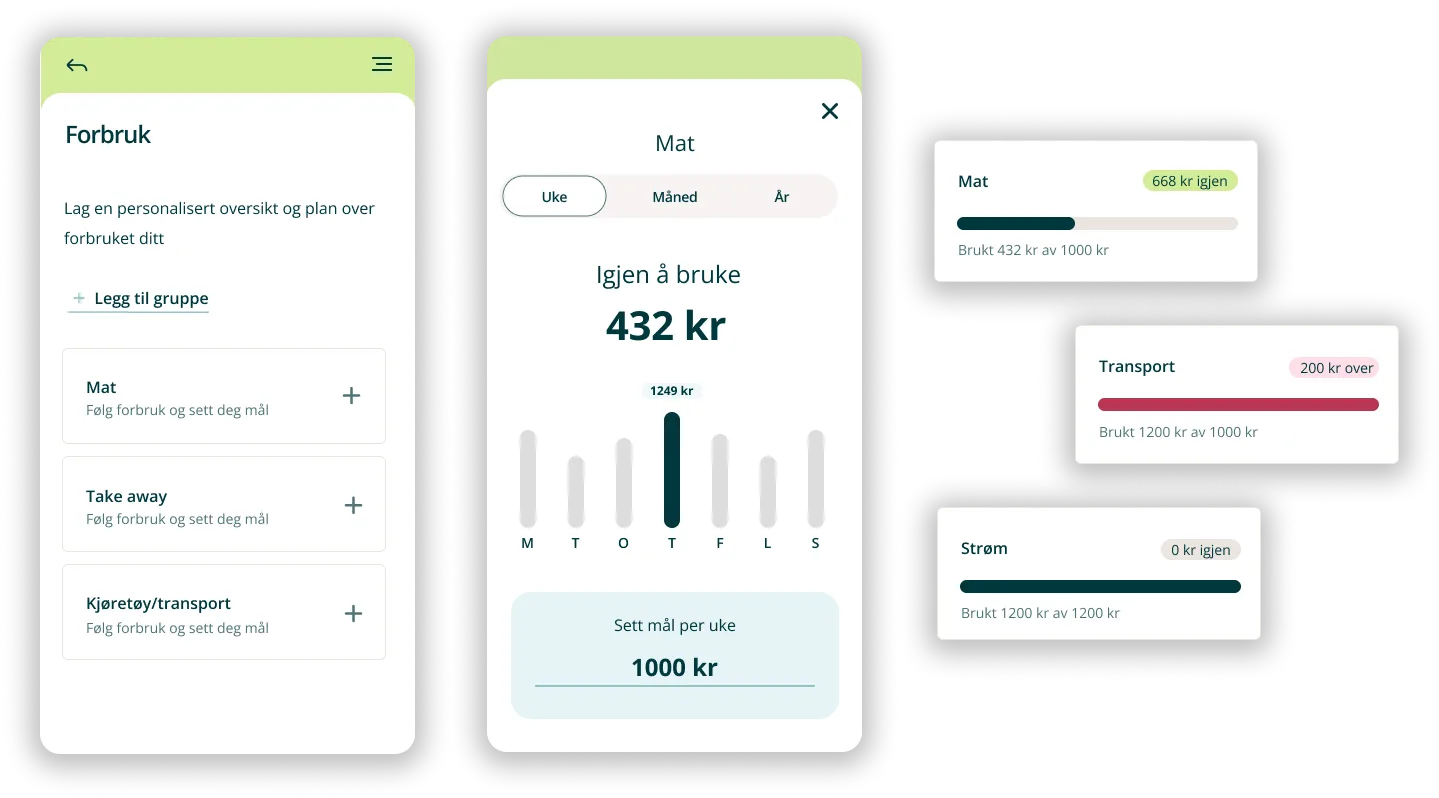
Many don’t want to know how much they’ve spent on different things, and would rather focus on how much they have left. So we made a concept focused on money left to spend. You can add weekly, monthly and yearly goals, as well as your own expenses.
Many liked that the focus was on money left to spend rather than money spent. It’s more positive and motivating.
Users also liked being able to add their own expenses and goals. “Great that you can choose between weekly, monthly and yearly goals – not everything has a weekly goal, after all.” The graphics were appreciated.
“Using red when you’ve used up the goal for the period is a bit much. Could it be orange instead? Or toned down?”
Concept 4
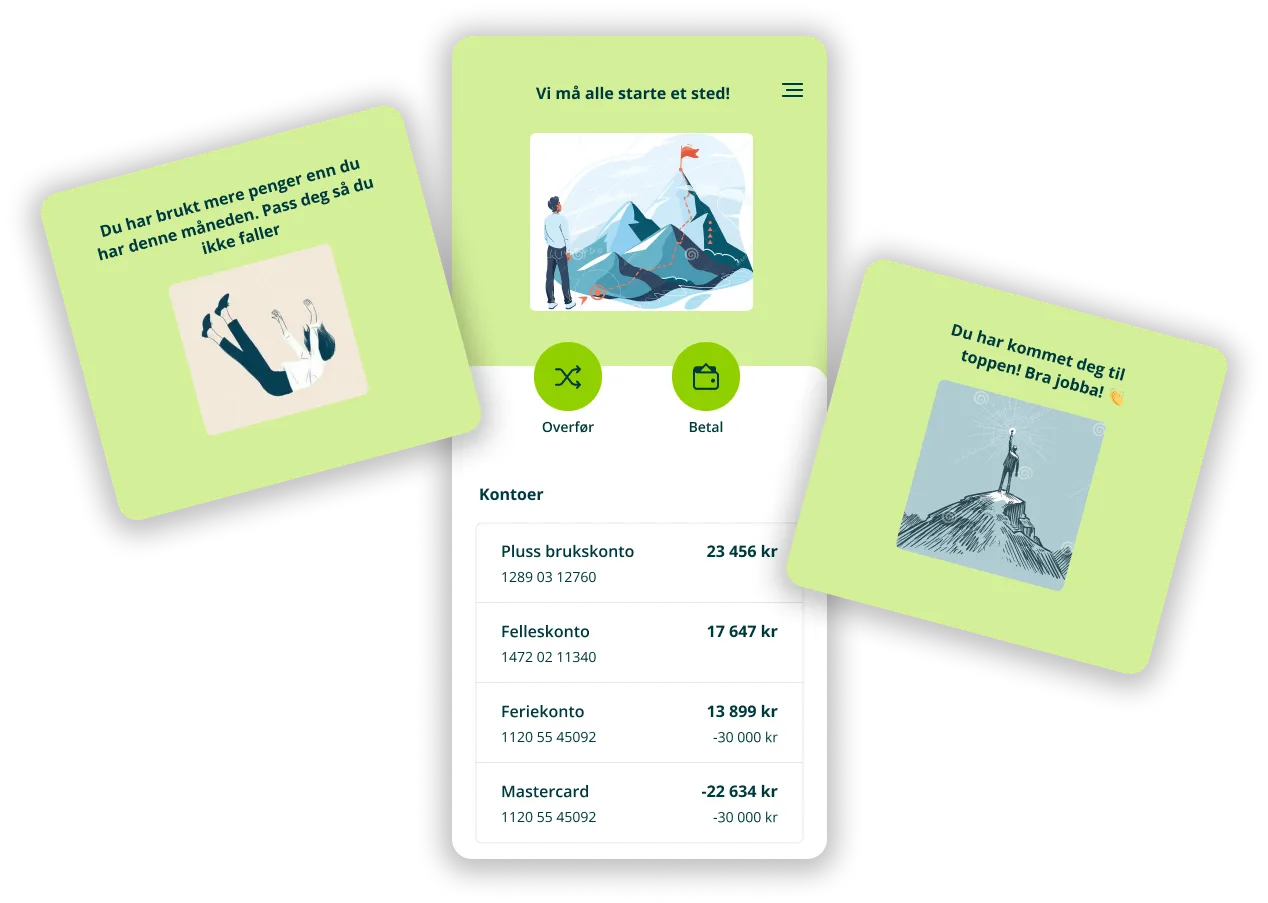
Many people get scared or worried when they see how much money they’ve spent. So we wanted to visualise spending in a way other than numbers. Here we found images to describe how you’re doing.
Users didn’t like this. Someone falling felt negative, and it wouldn’t motivate them. We asked whether plants would be different, and got the impression it might be better, but still not something they wanted.
Solution
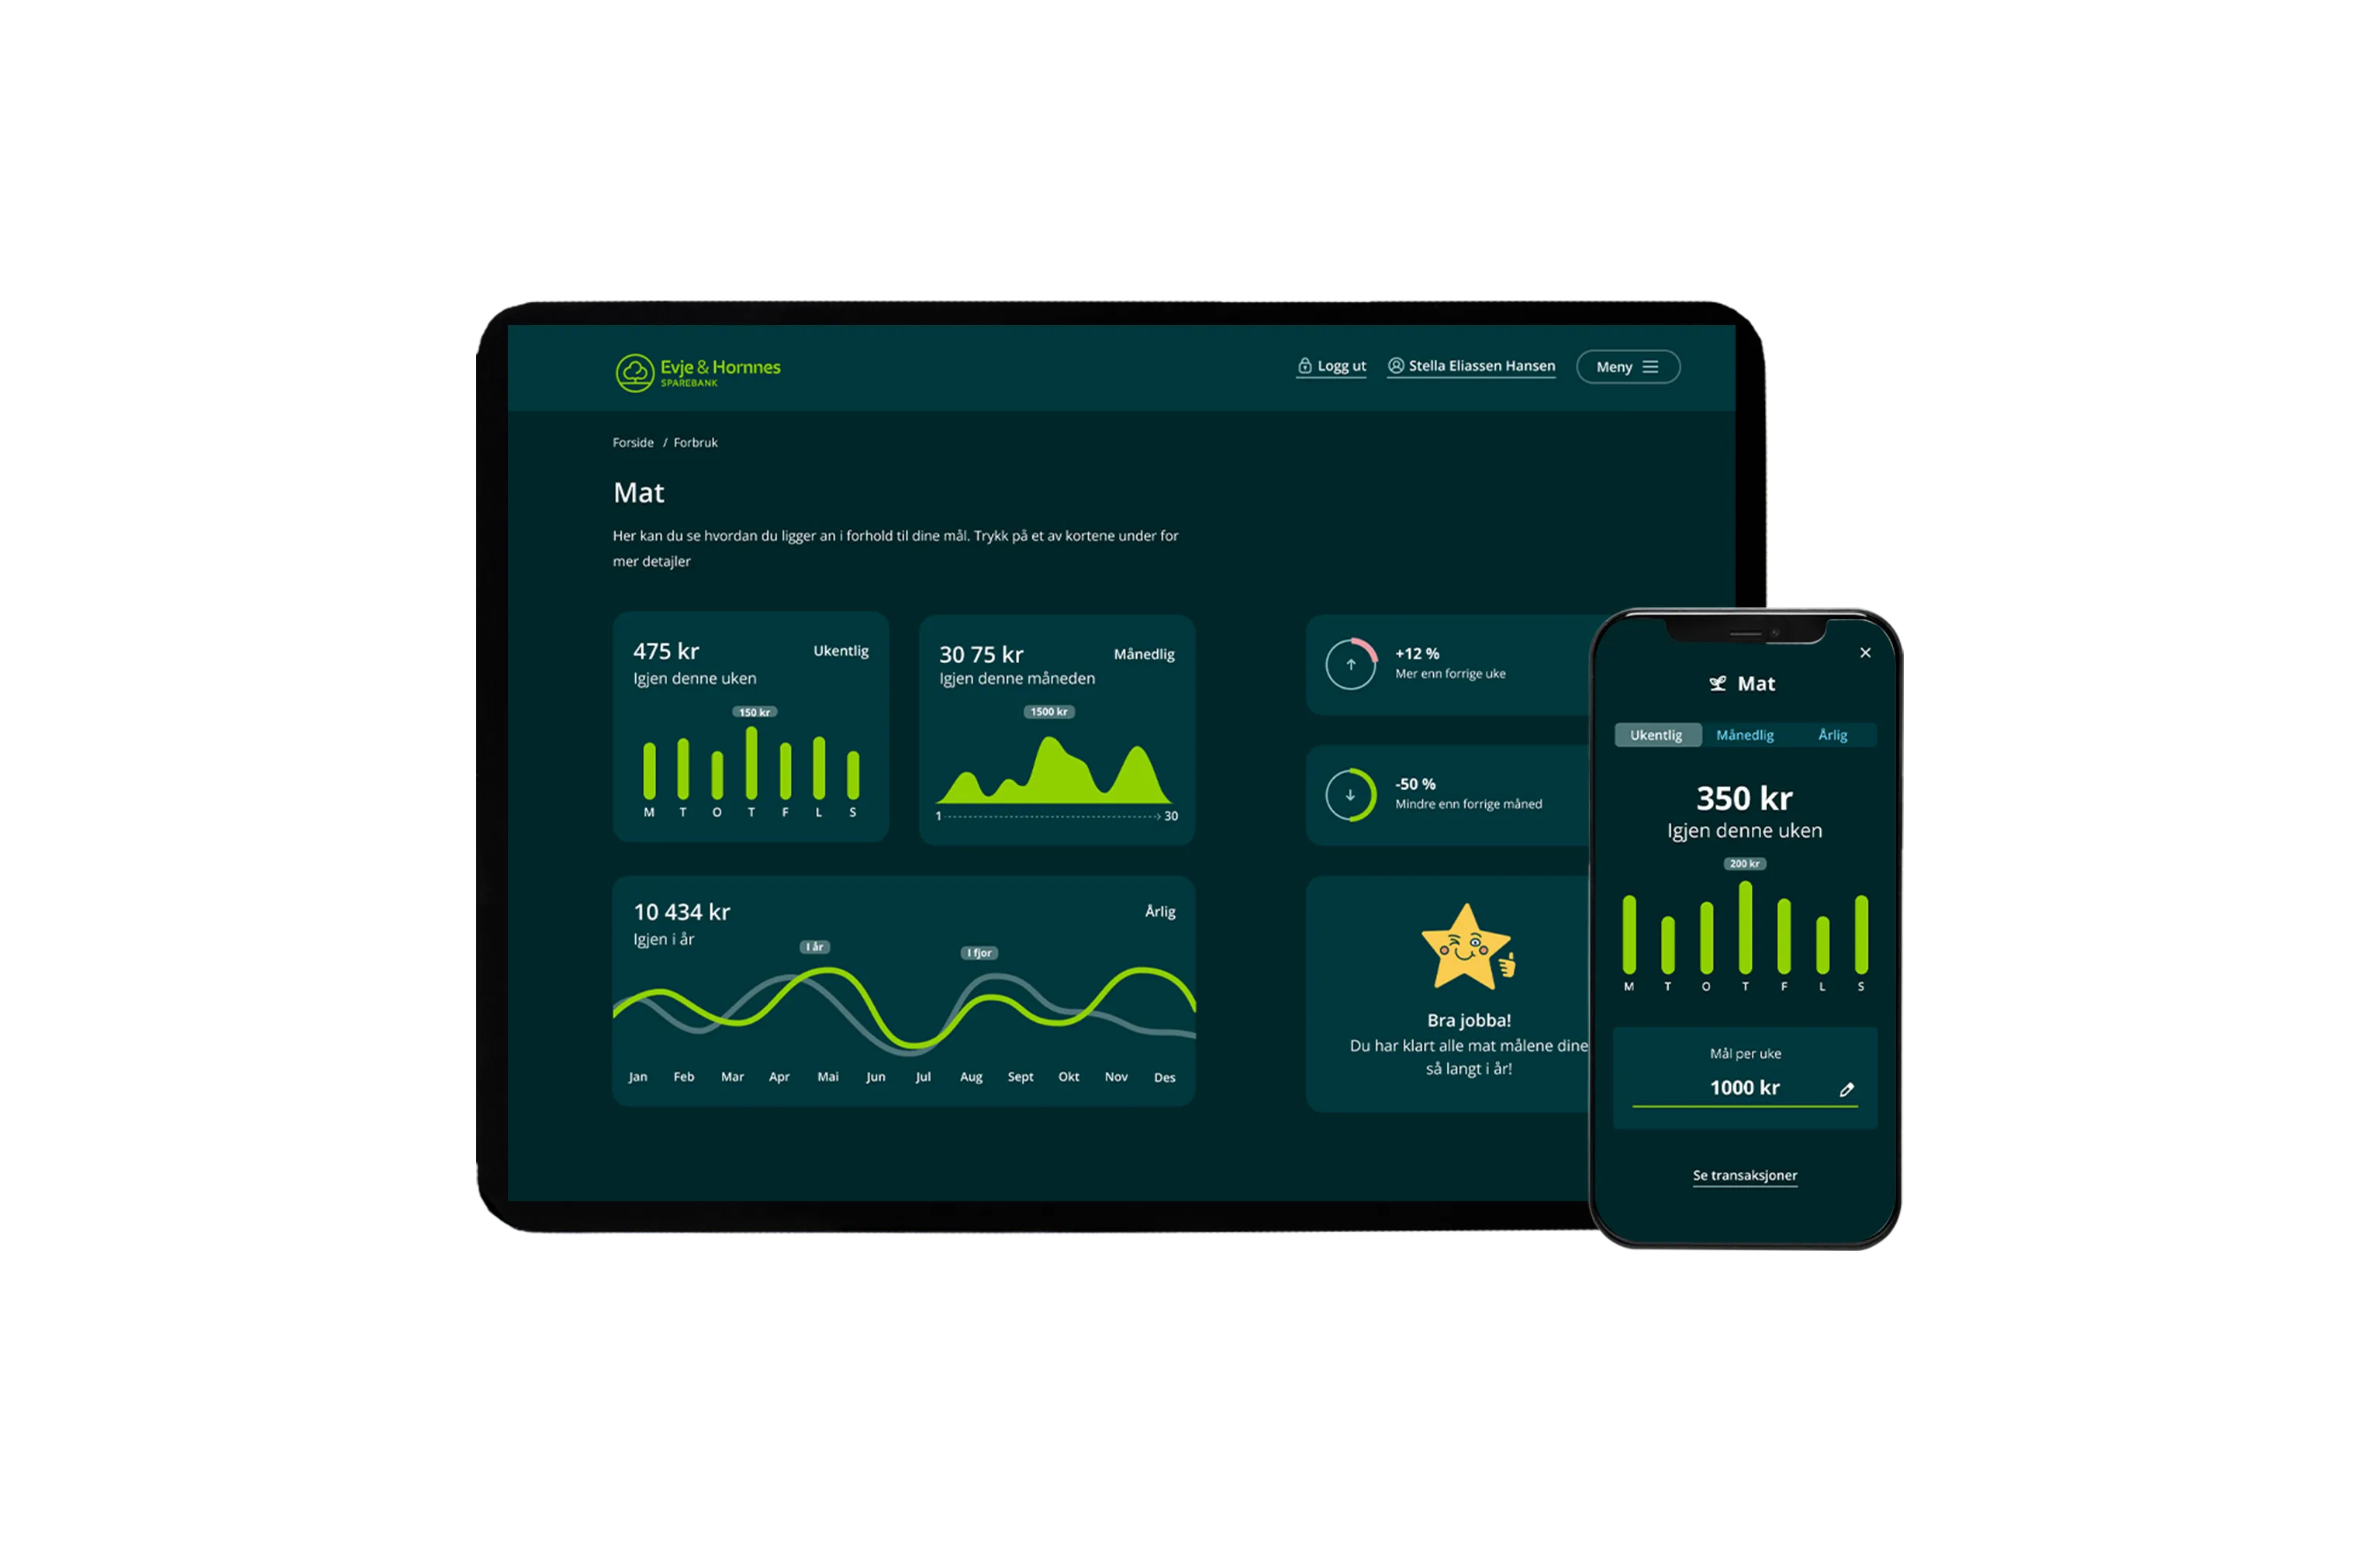
Mitt forbruk gives users insight into their finances. They can follow the expenses they want, using the transaction list and a little input from the user.
The design is in dark mode because it was something I wanted to explore. It would probably be implemented in light mode first.
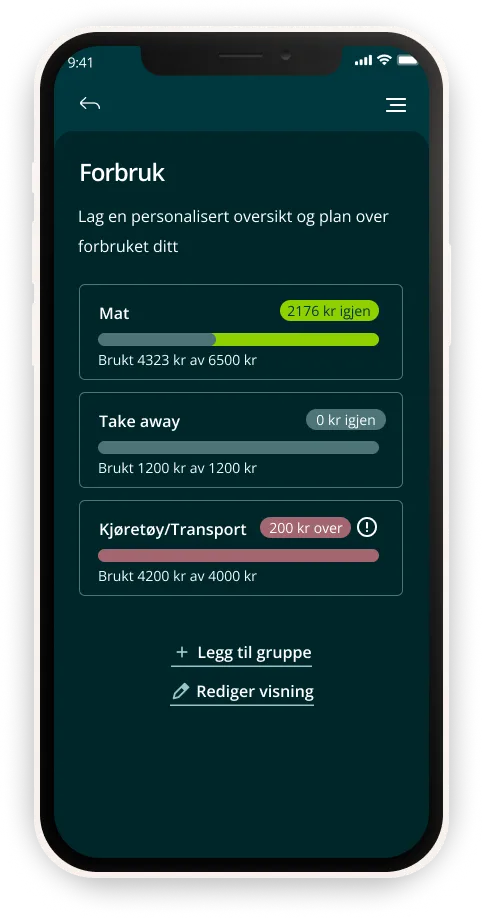
Three states
Once expenses are added and linked to the transaction list, spending is shown with a progress bar. If you have money left to spend, the bar is green; if it’s all used, it’s blue; and if you’ve gone over the goal, it’s red. The red is toned down so it isn’t too dominant, while still giving a subtle warning.
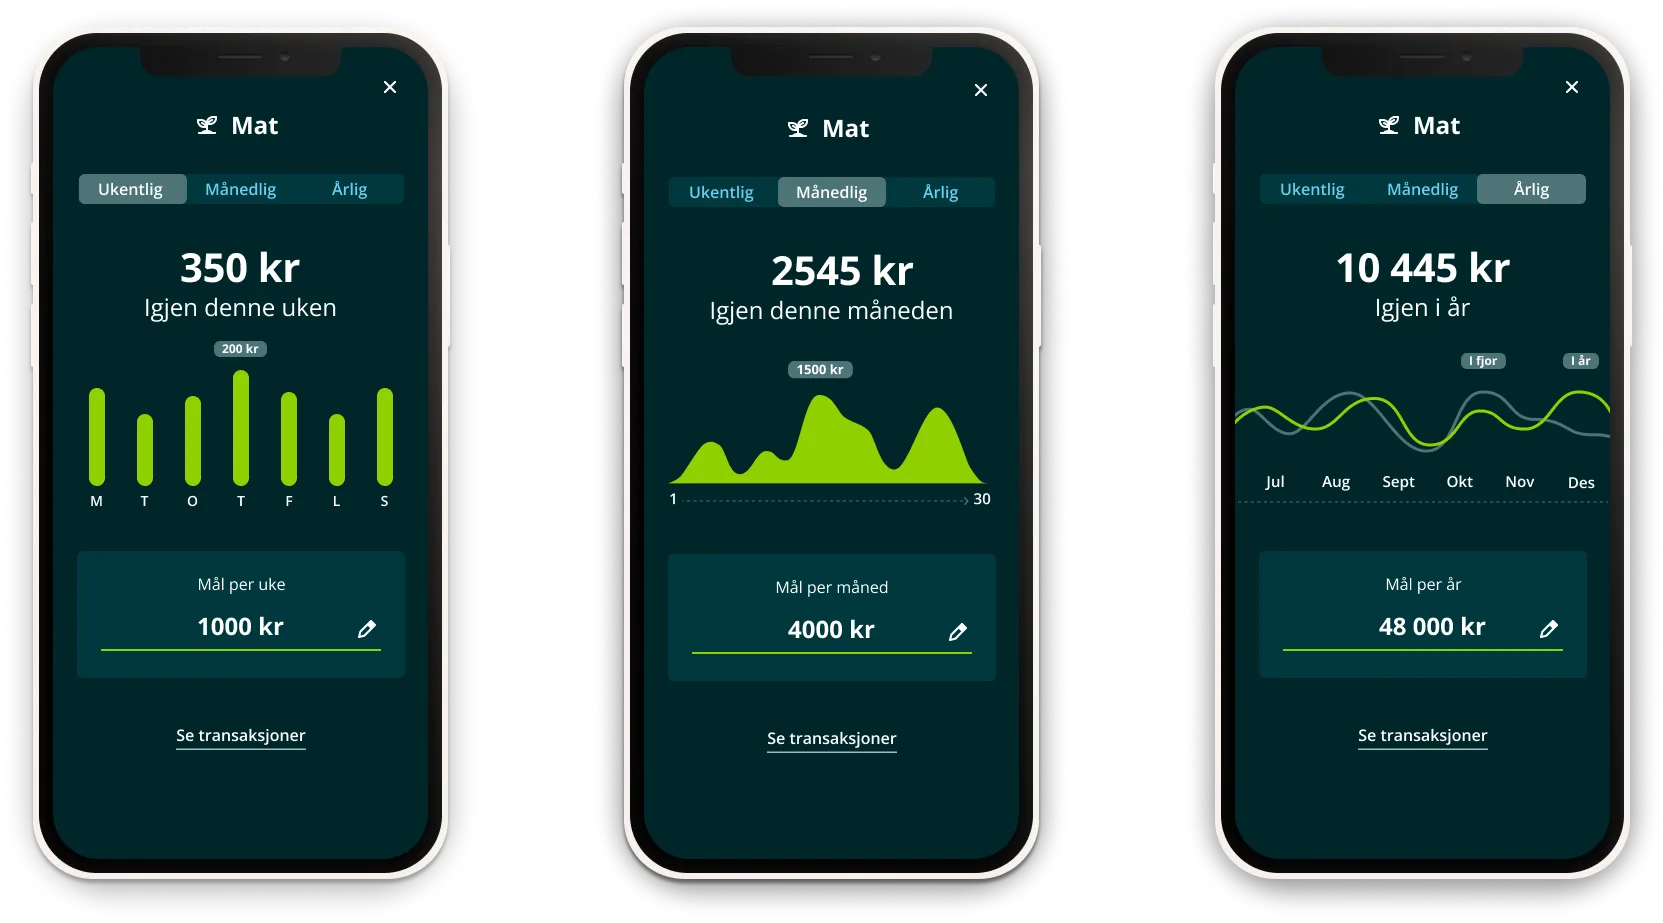
Weekly, monthly and yearly
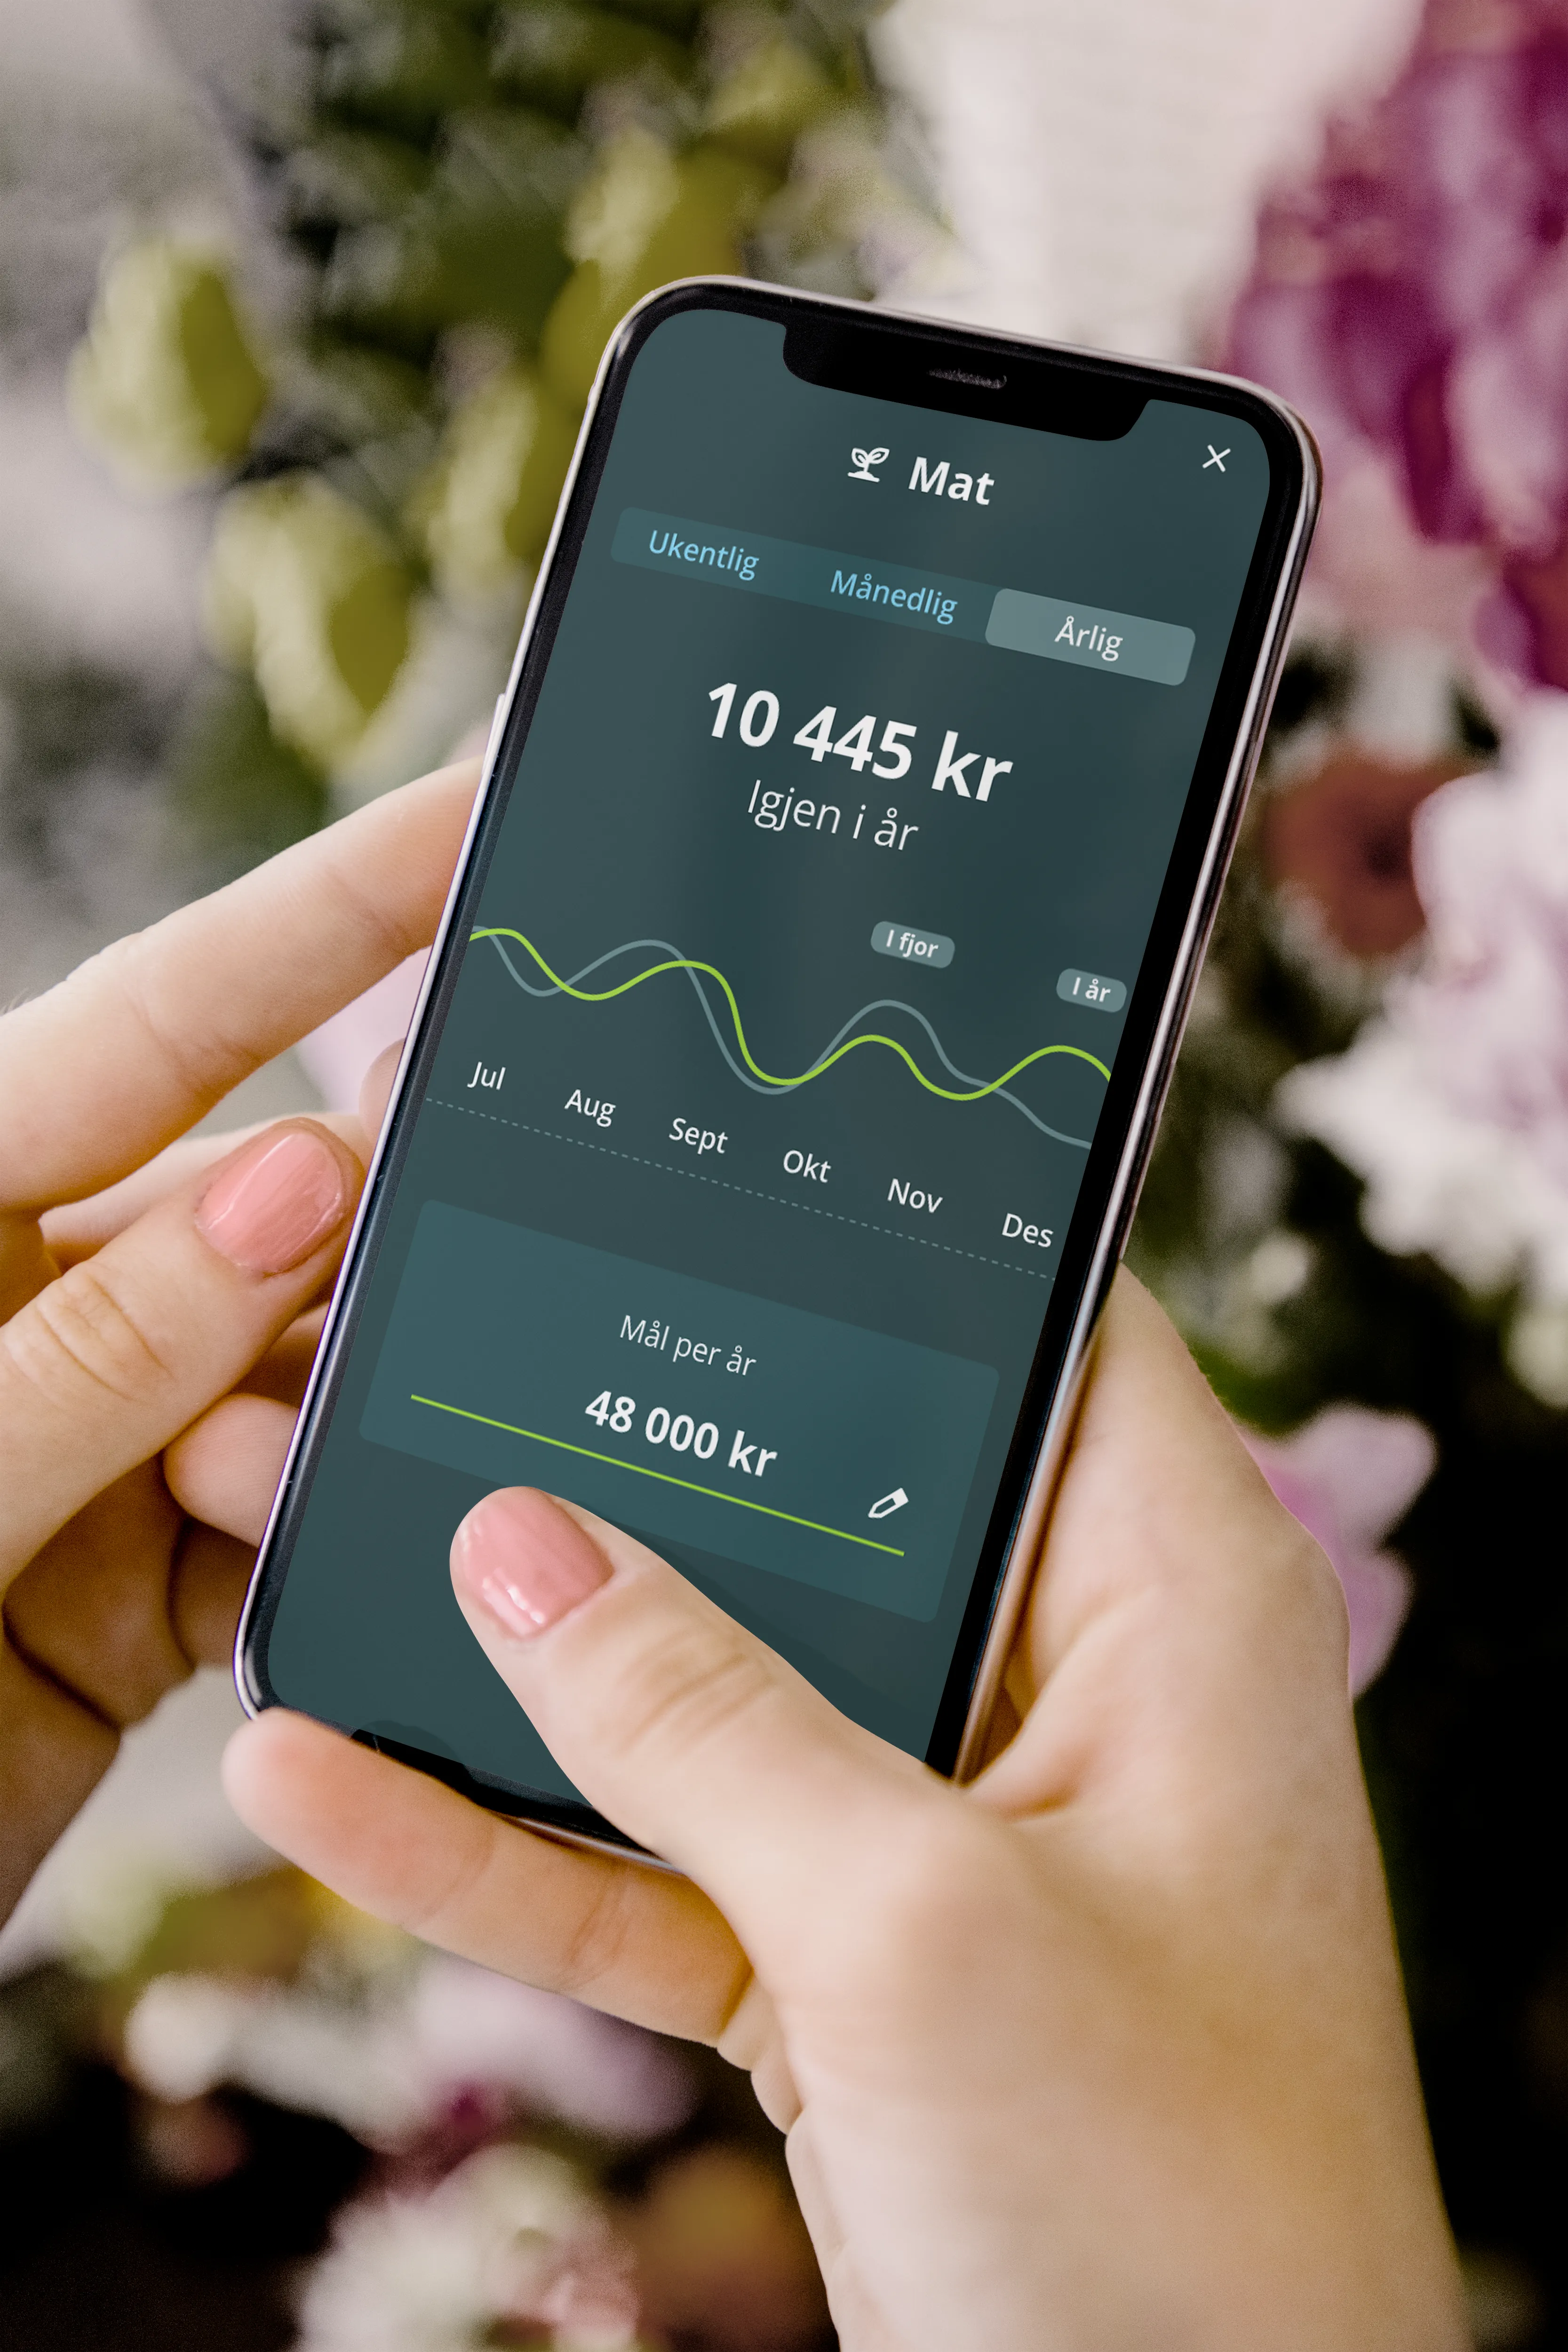
Users can see how they’re doing per week, month and year. We chose different charts to suit each time period.
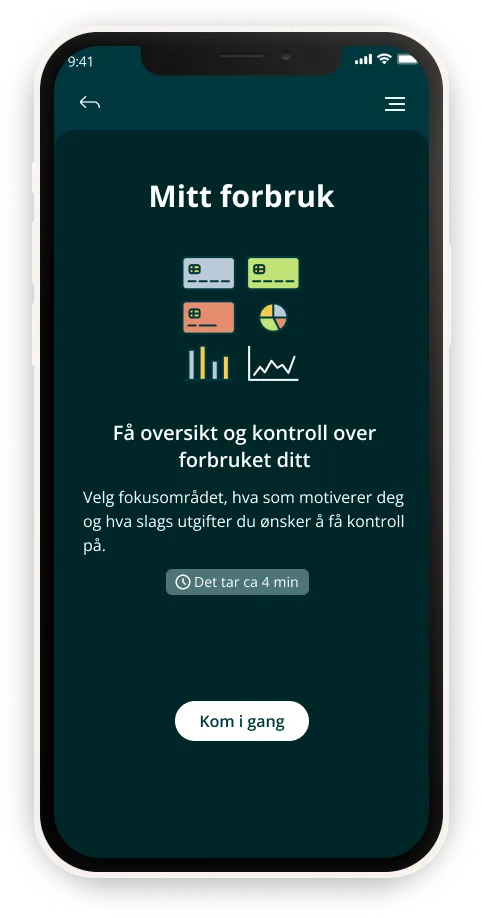
Getting started with Mitt forbruk makes it easy for users to begin using the feature. After user feedback, we added information about what you need to do and how long it takes.
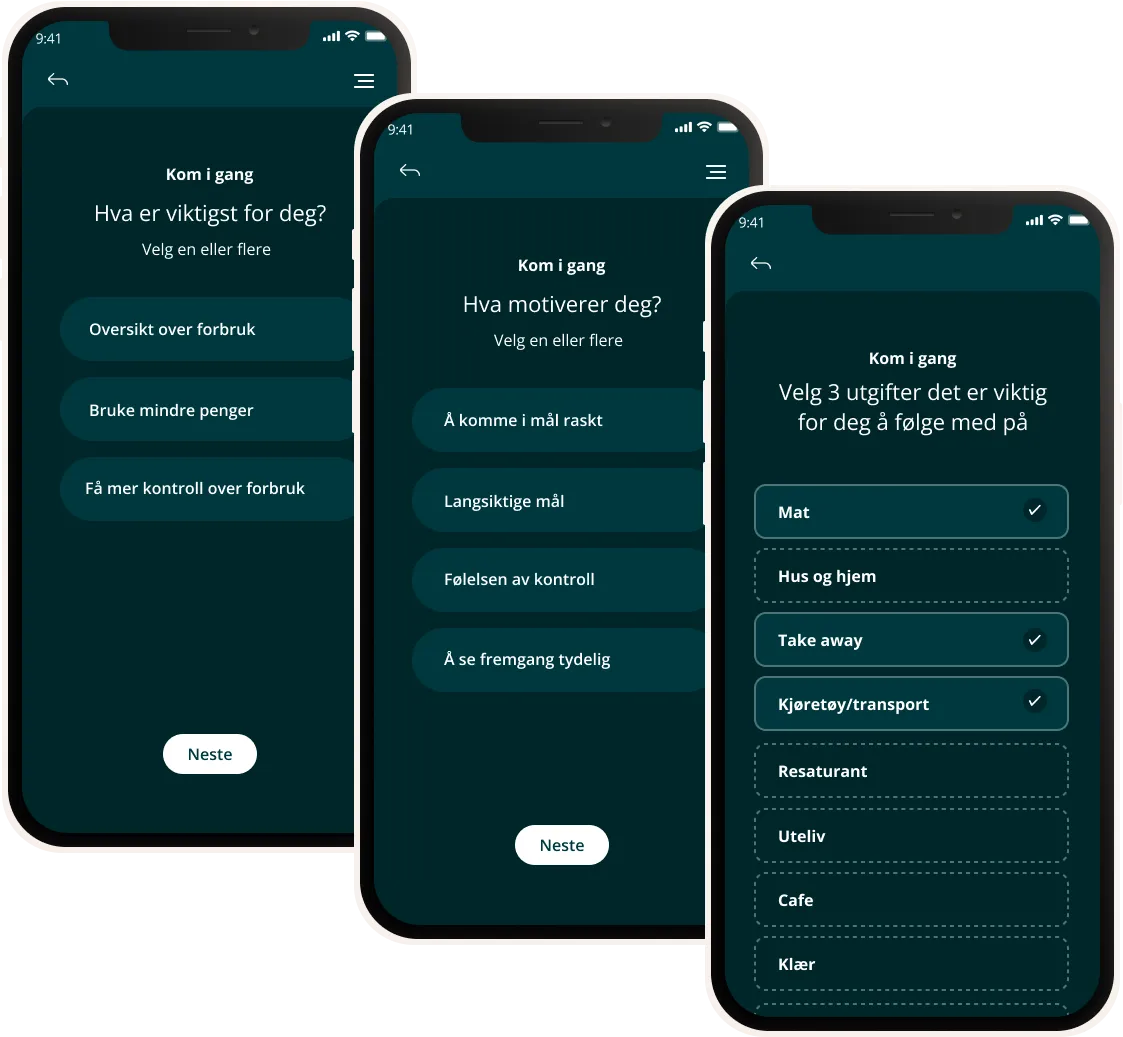
First, users choose what matters to them, and they can pick all three options, since several things can matter. The same goes for what motivates them. We also list many expenses to make it quicker to get started.
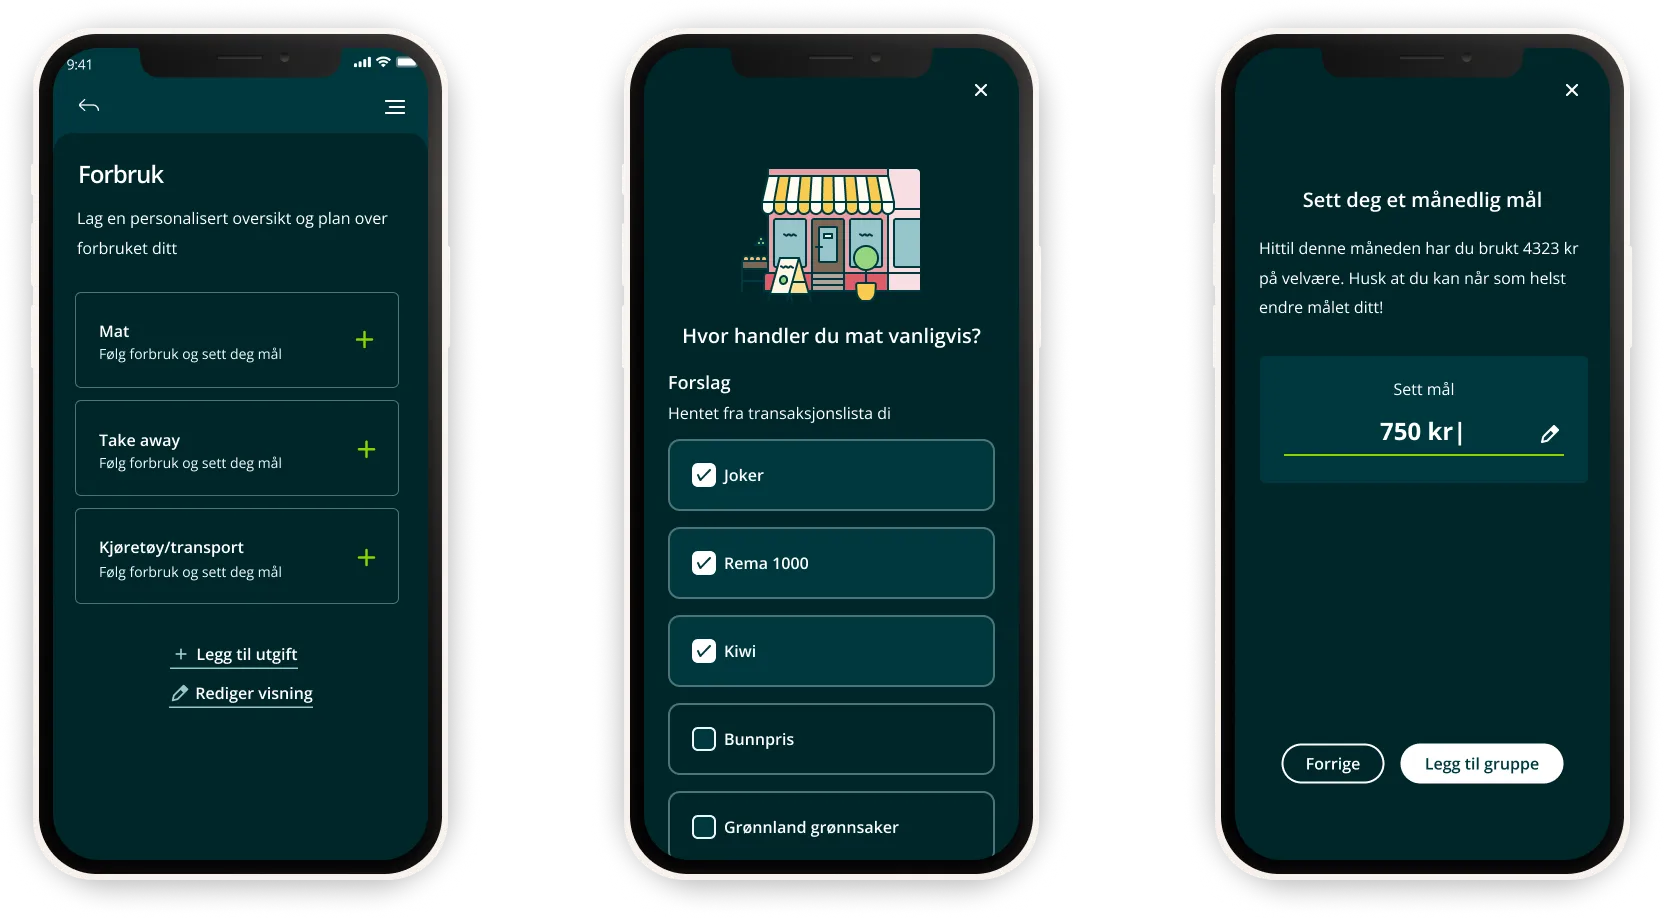
We would use the transaction list and machine learning to guess which shops and places the user buys from in each category. The user picks the right shops, then sets a monthly spending goal.
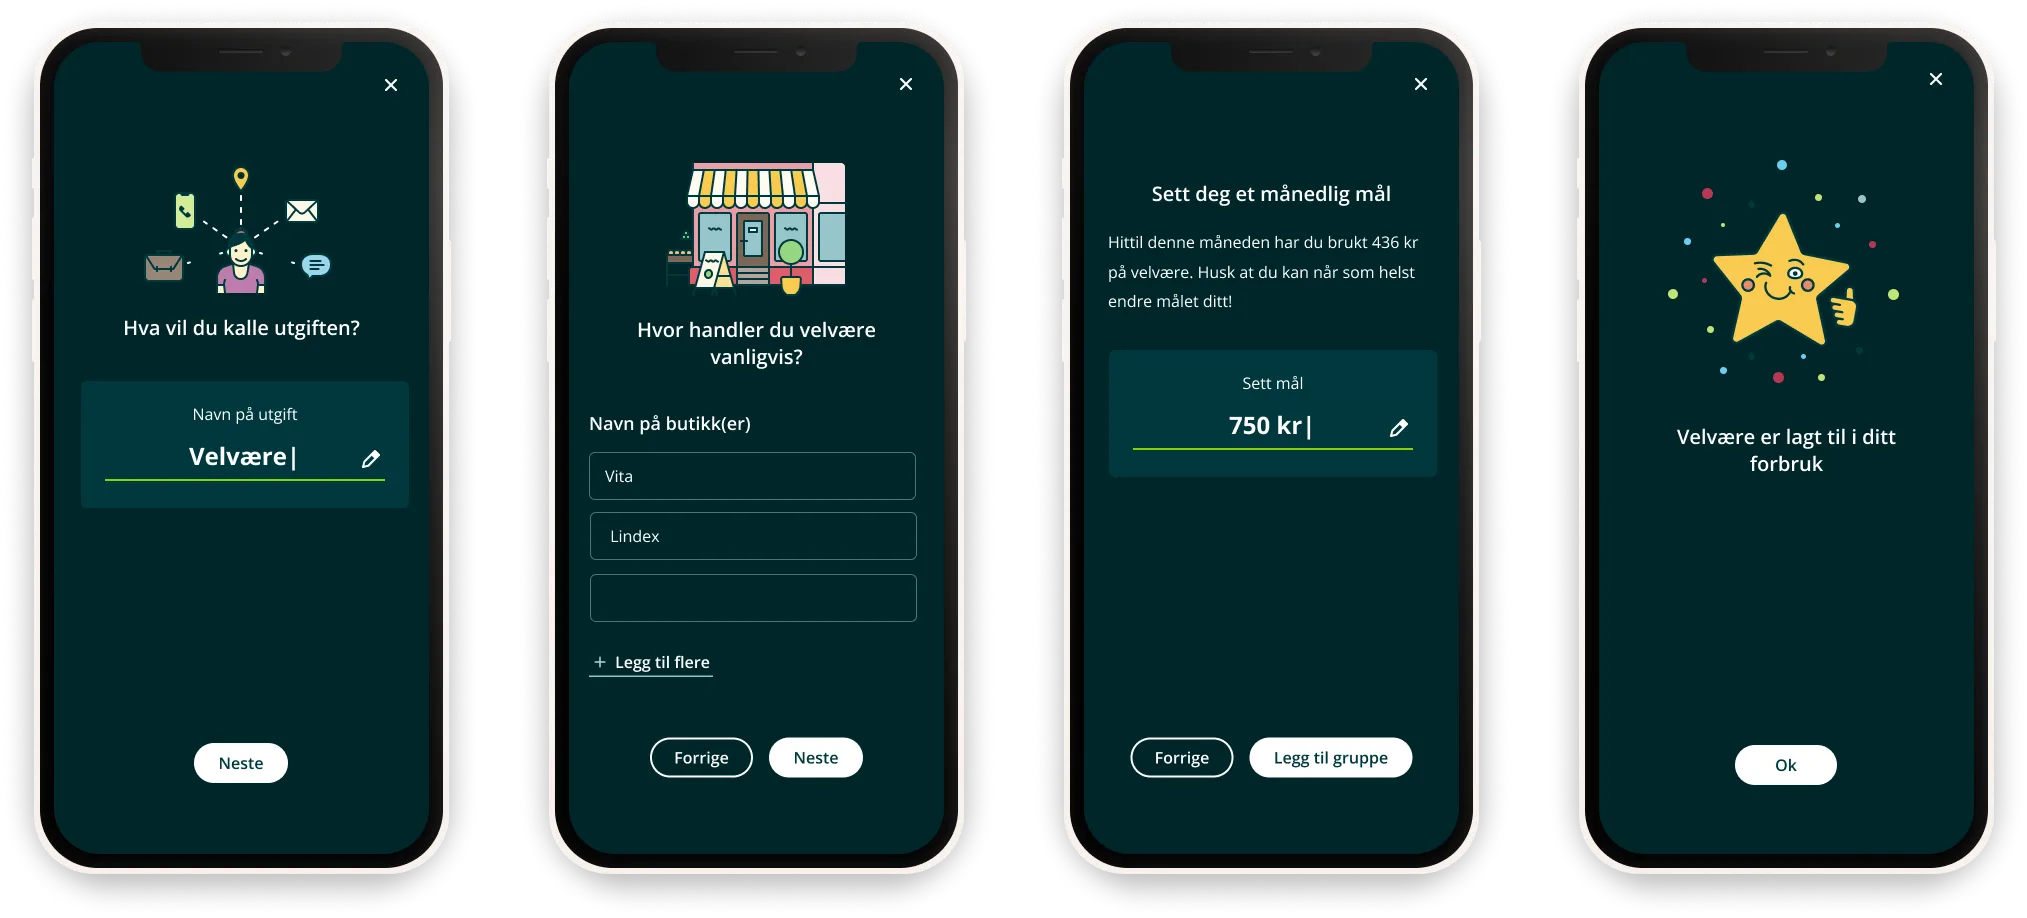
Users can add as many expenses as they like, and name them whatever they want. To link the transaction list, users write down the shops where they spend on that expense. Then they set a goal, and the expense is added to the Spending page.
Summary
The people who need the most help with money often don’t want to focus on how much they’ve spent, because it feels negative. They prefer to see how much they have left to spend. For those who aren’t struggling, following their spending is motivating. This shows how important it is to define the target group clearly – if the solution is to serve several groups, it has to be flexible.